TL;DR
- Solana (SOL) bounced back from intraday lows near $136.75 to consolidate around $140.46 despite a 1.41% 24-hour decline.
- A descending channel and bullish reversal pattern have formed, with strong volume support at $140.40.
- Technical resistance at $142.65 must be breached for a confirmed breakout toward higher targets.
- Solana’s ecosystem growth, including support for wrapped Bitcoin (WBTC) on its network, adds to bullish sentiment.
Solana Price Action and Technical Analysis
Solana’s native token, SOL, traded in a range between $135.96 and $142.91 over the past 24 hours, settling near $140.46 at press time, marking a 1.41% drop in daily terms. The dip followed a sharp 4.9% decline from $142.91 to $135.96 but was met with solid support around $140.40, signaling stabilization (CoinDesk Research).
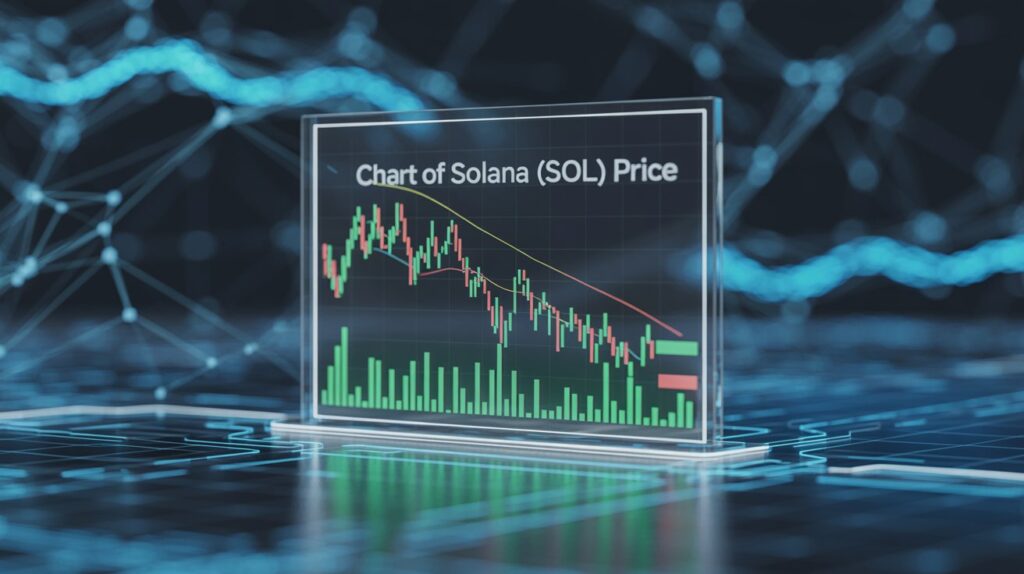
Technical charts reveal the formation of a descending channel, characterized by lower highs and lower lows, coupled with a bullish reversal pattern. This pattern is bolstered by high trading volume around the $140.40 mark, indicating strong buyer interest at this level.
Between 14:32 and 14:37 UTC, SOL spiked from $140.48 to $141.40, but selling pressure during the 15:10 candle capped the rally at $142.65 resistance, which has held firm for now.
To confirm a sustained breakout, SOL must decisively breach the $142.65 resistance level, which could open the path toward targets closer to $160 and beyond.
Ecosystem Growth and Market Sentiment
Solana’s ecosystem continues to expand rapidly, enhancing the network’s utility and attractiveness to investors. Recent announcements include support for wrapped Bitcoin (WBTC), allowing BTC holders to leverage Solana’s high-speed blockchain for decentralized finance (DeFi) applications.
Market analysts remain divided: some bullish on a push toward $200 fueled by growing adoption and technical momentum, while others caution about a potential retracement to the $123–$135 range amid broader market uncertainty.
The general sentiment reflects a cautious optimism, with strong hands defending the $140 support as a critical battleground for SOL’s next directional move.
Technical Indicators and Market Outlook
- Support Zone: $140.40 confirmed by volume spike during midday trading.
- Resistance Zone: $142.65 level tested twice but not breached.
- Volume: Concentrated selling volume observed during session lows, indicating possible short-term bearish pressure.
- Chart Patterns: Descending channel and bullish reversal suggest a potential trend change if resistance breaks.
If SOL overcomes the immediate resistance, technical models predict an upward trajectory that could accelerate buying interest. Conversely, failure to breach this zone may result in a short-term pullback to test support levels near $135 and possibly $123.
Solana (SOL) Price Summary
| Metric | Details & Sources |
| Price Range (24h) | $135.96 – $142.91 (CoinDesk Price) |
| Last Price | $140.46 (CoinDesk Price) |
| Daily Change | -1.41% (CoinDesk Price) |
| Key Support Level | $140.40 (confirmed by volume spike) |
| Key Resistance Level | $142.65 (tested twice) |
| Chart Pattern | Descending channel and bullish reversal (CoinDesk Technical Analysis) |
| Recent Network Update | Support for wrapped Bitcoin (WBTC) on Solana network (Solana Ecosystem) |
Conclusion
Solana’s SOL is currently navigating a critical technical juncture, holding key support near $140 amid a developing bullish reversal pattern. The token’s consolidation after a significant dip, coupled with ecosystem expansions like WBTC support, could position SOL for a strong breakout—provided it surpasses resistance at $142.65.
Investors and traders should watch volume and price action closely in the coming days to assess whether the bullish momentum can sustain or if a retracement is imminent.


